
Monitor hapi based web service with Application Insights
Application Insights is a great tool which allows developers to get better understanding of what’s going on insight their applications and services. It’s platform-agnostic and can be used from pretty much everywhere: from ASP.NET and node.js on the server to client-only applications running in the browser. The documentation is quite good and will help you get started, but there is one thing that I found missing. There is a page describing how to interface Application Insights into node.js application, but it’s using node HTTP server in all the examples. While it might work for some, it doesn’t work for me. The app I’m currently working on uses hapi. In this post I’ll show how in just few lines of code you can instrument hapi-based application and get data flowing into Application Insights.
To keep the example simple I decided to start with a super simple hapi-based Hello World app. It starts a web server which returns “Hello World” for all the requests. Nothing fancy - I just copied it from hapi’s tutorial page.
'use strict';

const Hapi = require('hapi');
const server = new Hapi.Server();

server.connection({ port: 3000, host: 'localhost' });
server.route({
    method: 'GET',
    path: '/',
    handler: function (request, reply) {
        reply('Hello, world!');
    }
});
server.start((err) => {

    if (err) {
        throw err;
    }
    console.log(`Server running at: ${server.info.uri}`);
});
Now that we have a web server, we can try getting telemetry out of it. Application Insights has a node.js agent library and you can get it from npm:
npm install applicationinsights --save
It will download it and add it as dependency to your package.json.
With that we can start using it in our code. First of all, we need to configure it with our instrumentation key. That’s how your telemetry will be matched to your Application Insights instance. This step is not specific to hapi and is exactly the same as what you’d do if you were following the official documentation.
const appInsights = require("applicationinsights");
appInsights.setup("<instrumentation-key>");
appInsights.start();
Now the fun part - hapi integration.
hapi allows for various customization based on extension points.
There are multiple parts of the server and request life-cycle you can inject your logic to.
The one we are interested in is onPreResponse.
It will get called after the request processing is done, but before response is sent to the client.
Sounds like a perfect place to collect some telemetry.
Registering an extension is super easy.
All you need is to call ext function on server object and pass an object with type and method properties.
Let’s try that with a simple extension which prints the request object into console:
server.ext({ type: "onPreResponse", method: (request, reply) => {
    console.log(request);
    reply.continue();
}});
After running the application and sending a request to localhost:3000 you should see a lot of things printed in the console:
{ _eventListeners:
   { finish: { handlers: null, flags: [Object] },
     peek: { handlers: null, flags: [Object] },
     disconnect: { handlers: null, flags: [Object] } },
  _notificationsQueue: [],
  _eventsProcessing: false,
  _sourcePodiums: [],
  onPodiumError: [Function],
  _bench: { ts: 174388248.645979 },
  connection:
   { _eventListeners:
      ...
The entire thing has ~600 lines and contains everything there is about the request and response.
With that extension point we can try logging the data to Application Insights instead of the console.
The most intuitive way would be to just pass request and request.response to appInsights.client.trackRequest so let’s try just that:
server.ext({ type: "onPreResponse", method: (request, reply) => {
    appInsights.client.trackRequest(request, request.reponse);
    appInsights.client.sendPendingData();
    reply.continue();
}});
I added sendPendingData request to flush the data on every request.
While in production you’d like the telemetry to be batched on the server and only periodically sent to Azure, in our case we’re just testing the pipeline so flushing the data earlier will make it easier to see if the system is working.
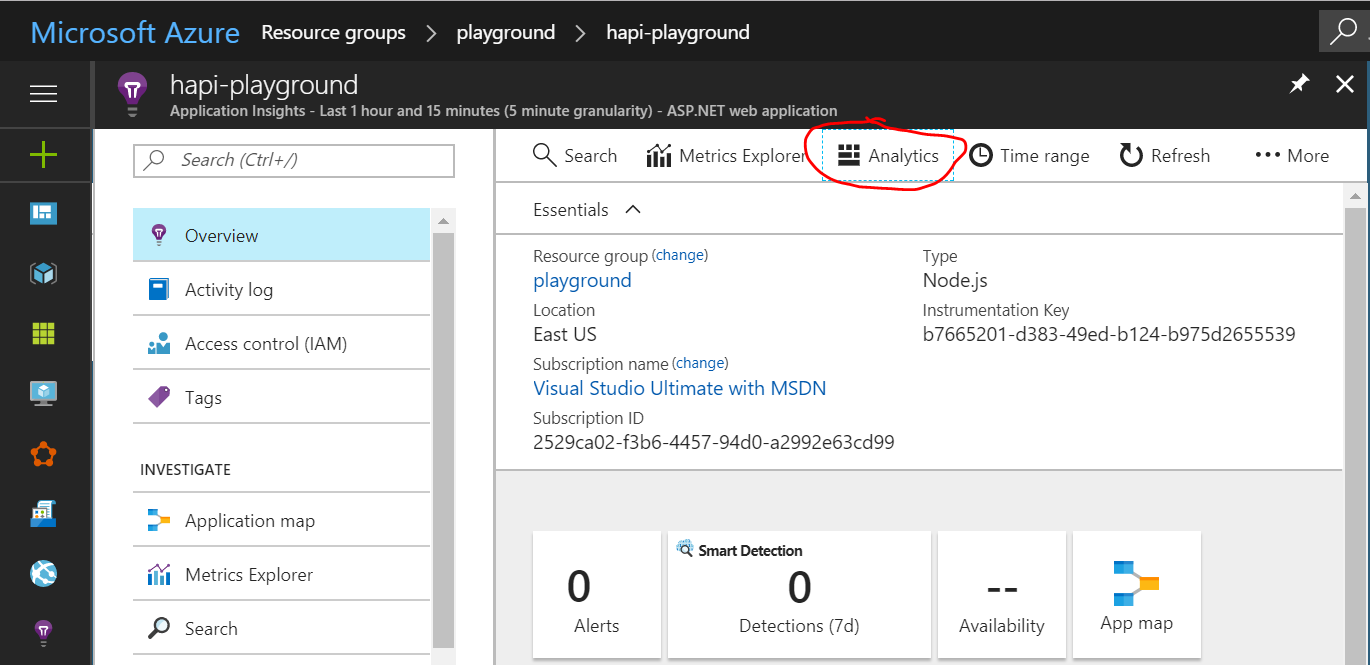
How do we check if the data was sent to Application Insights? You can log to your Azure account, navigate to your Application Insights instance and Analytics to open data explorer.
In data explorer you can create a new quest and try fetching all the request data for last 5 minutes by running following query:
requests | where timestamp > ago(5m)
If it worked you should see request information returned:
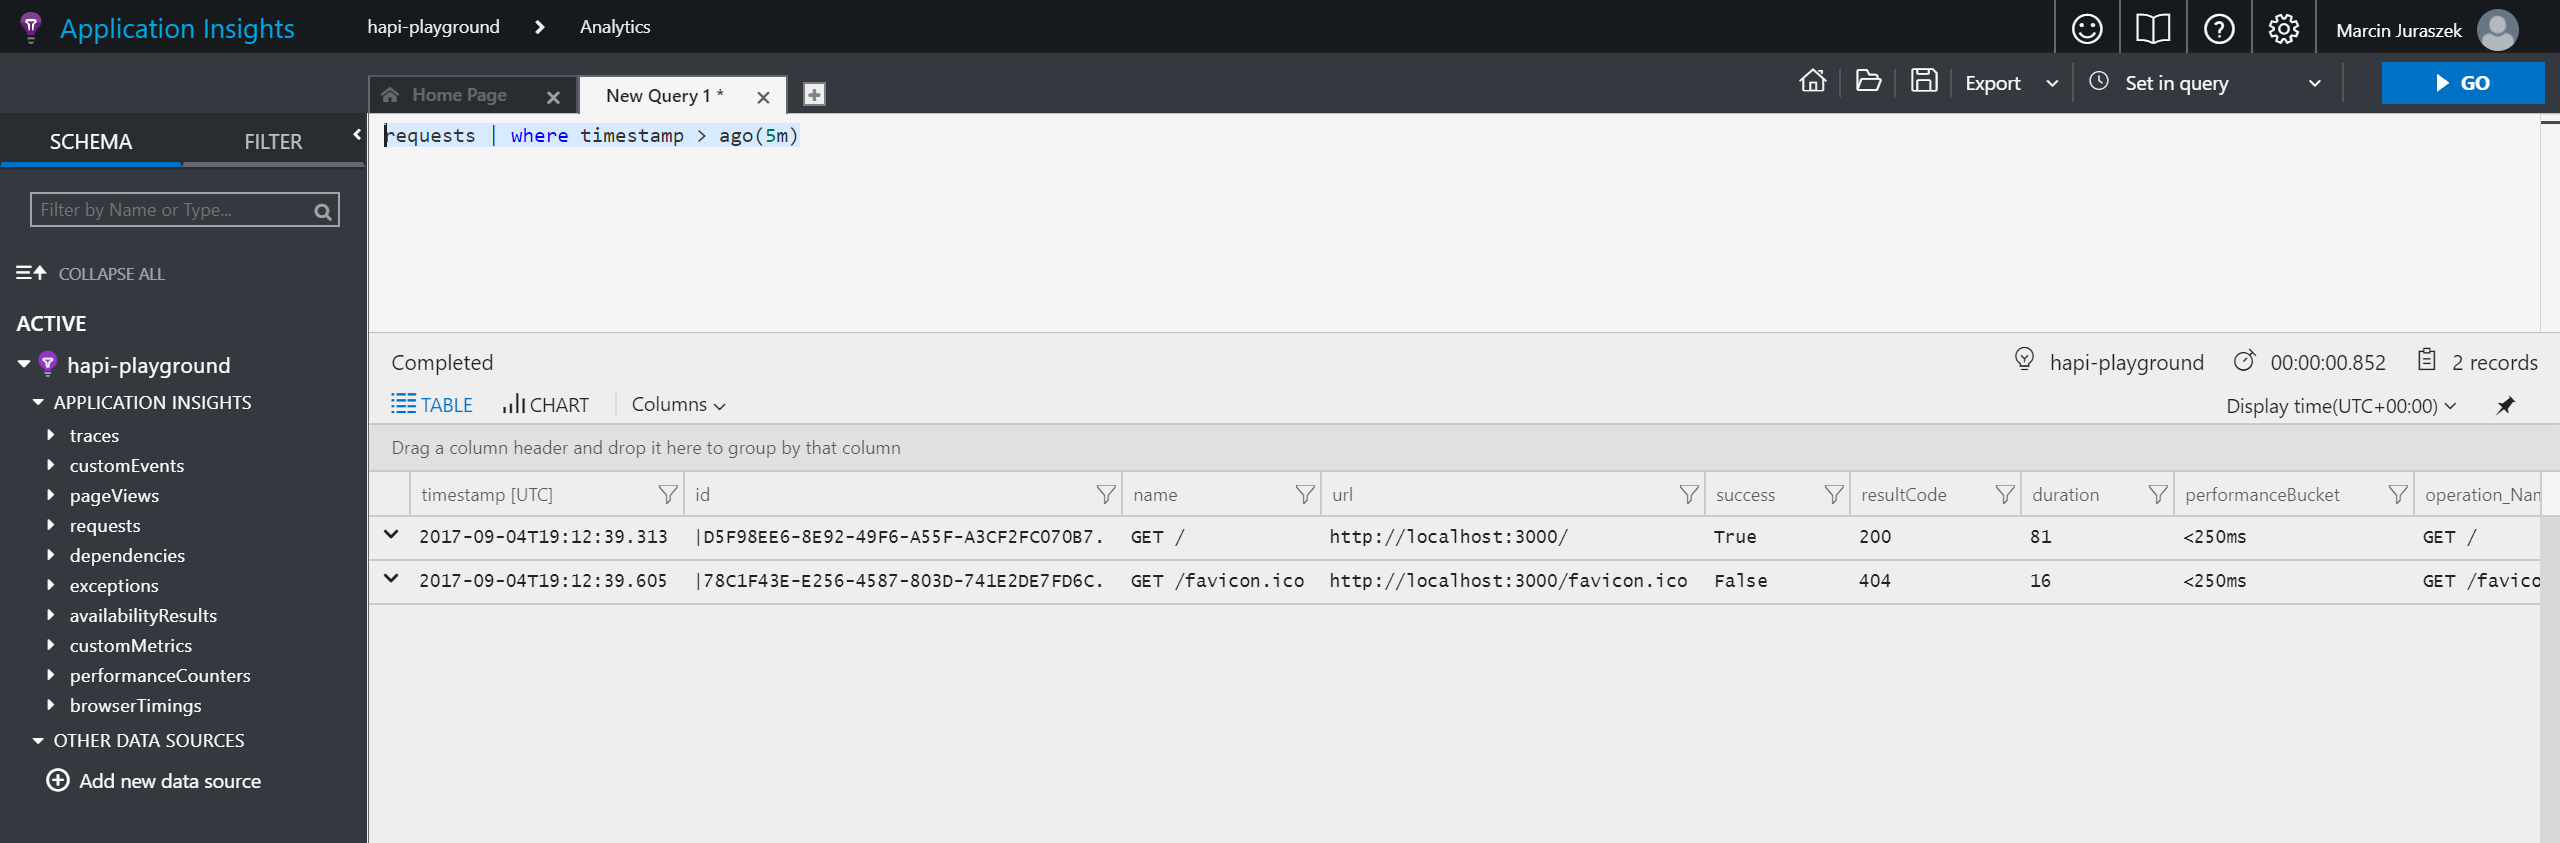
With just few lines of code you get a lot of useful request information including browser data, location information, performance metrics and more.
You can use the same appInsights client to send other data including metrics, custom events, exceptions and more.
client.trackEvent("my custom event", {customProperty: "custom property value"});
client.trackException(new Error("handled exceptions can be logged with this method"));
client.trackMetric("custom metric", 3);
client.trackTrace("trace message");
All that data can be later queried and analyzed to give you better understanding of users behavior and how your system behaves.